How to increase connectivity in the state of Amazonas? The state of Amazonas lags behind in digital integration, with only 58.5% of cities having broadband internet access compared to Brazil’s 77.9%. Access to 3G and 4G is also below the national average, limiting essential services like telemedicine, education, and safety. Faced with this scenario, the challenge arises: how to increase connectivity in the state of Amazonas?
My Role
Performance as a UX/UI Designer: leading the team to a desk research, brainstorming, feature prioritization, creation of a wireframe, and high-fidelity prototype.
Learnings
Constant Communication
Collaborating with a multidisciplinary team taught me to maintain ongoing communication and feedback, especially with developers during the prototyping stage
Team Facilitation
I led team dynamics like desk research, brainstorming, and wireframing to align ideas, speed up the process, and ensure we delivered real value
Flexibility & Team Decisions
We dropped the API map idea late in the project due to tech limits. Adapting quickly, we redesigned flows and added a screen for manual network registration.
The Process
Desk Research
After receiving the challenge, the first thing we sought to do was research the problem more thoroughly to see if there were initiatives already trying to solve it and how they did. We found that there is a optical fiber installation program in progress, but there are various geographical and financial difficulties in implementing it, making the whole process time-consuming.
Brainstorming
After reviewing the survey findings, our team brainstormed how to expand connectivity in Amazonas. We decided to connect potential investors and businesses with locations lacking connectivity to facilitate new network installations. Additionally, we proposed involving local residents affected by connectivity issues, enabling them to assess signal quality in each location.
Solution
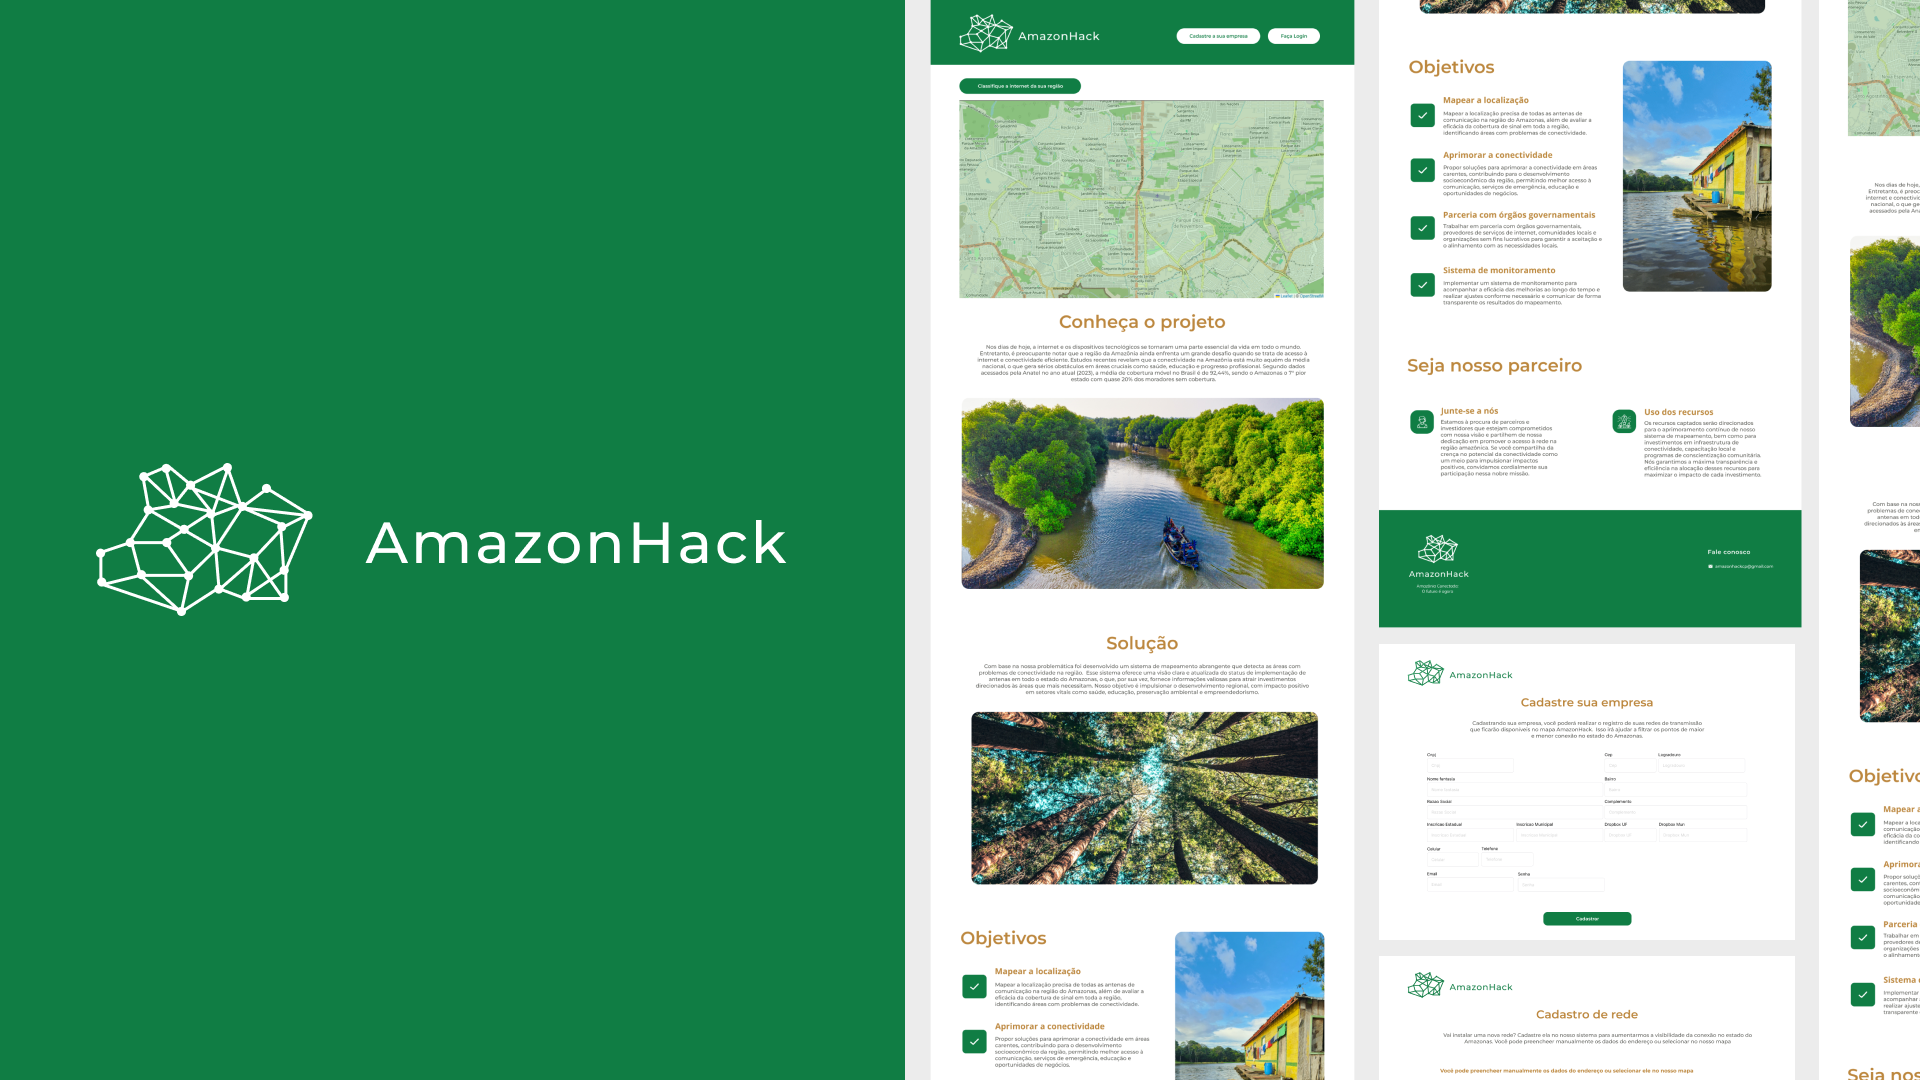
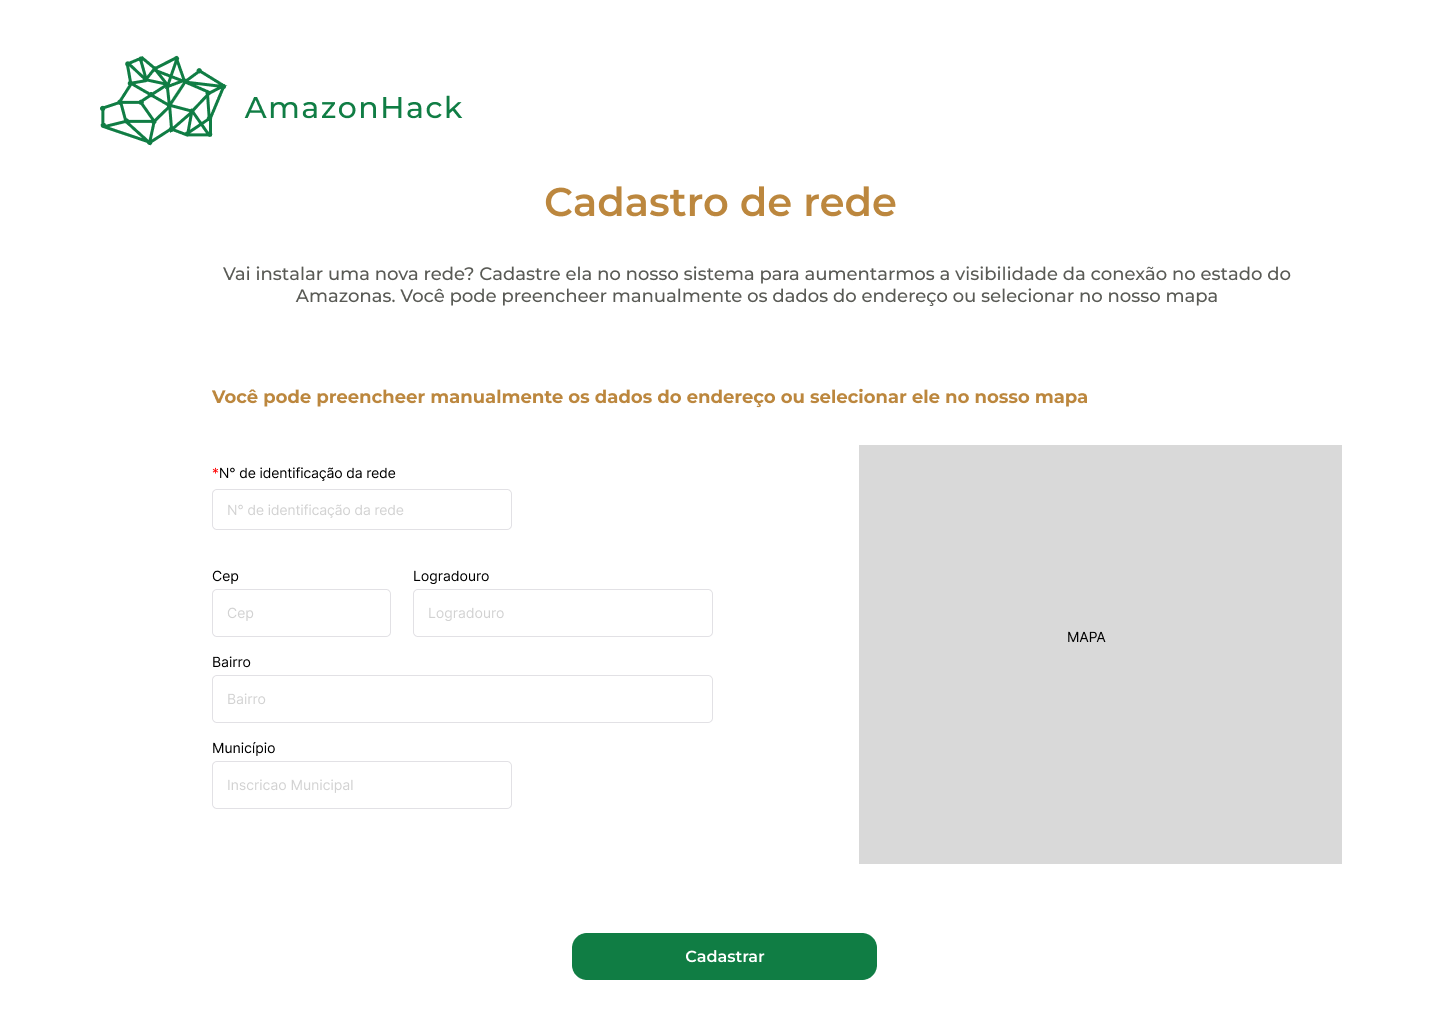
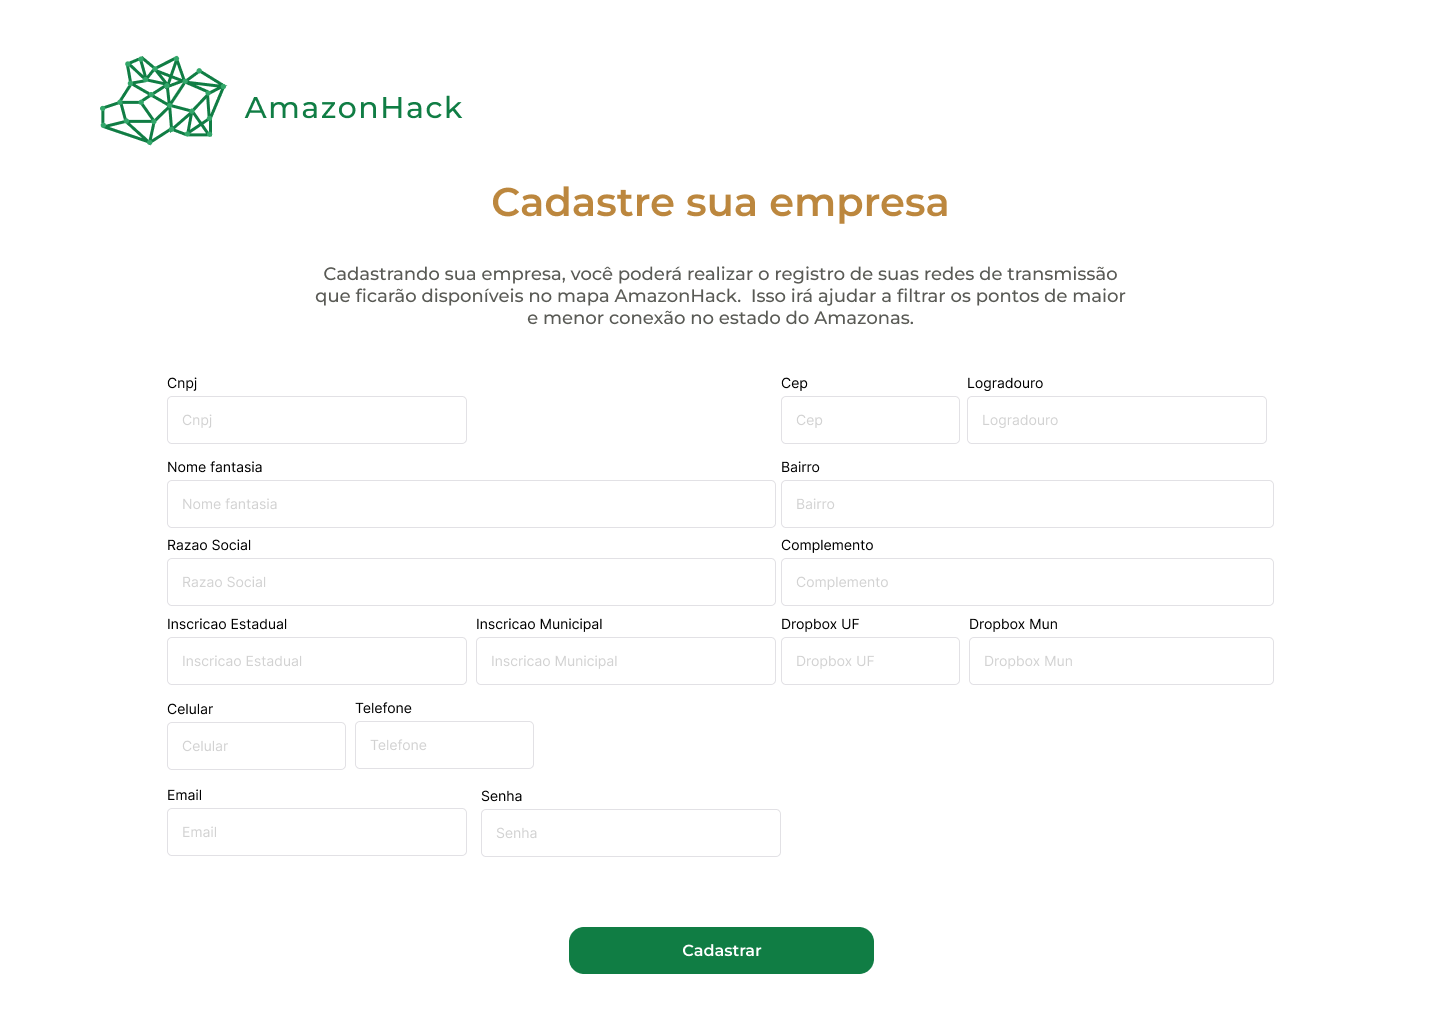
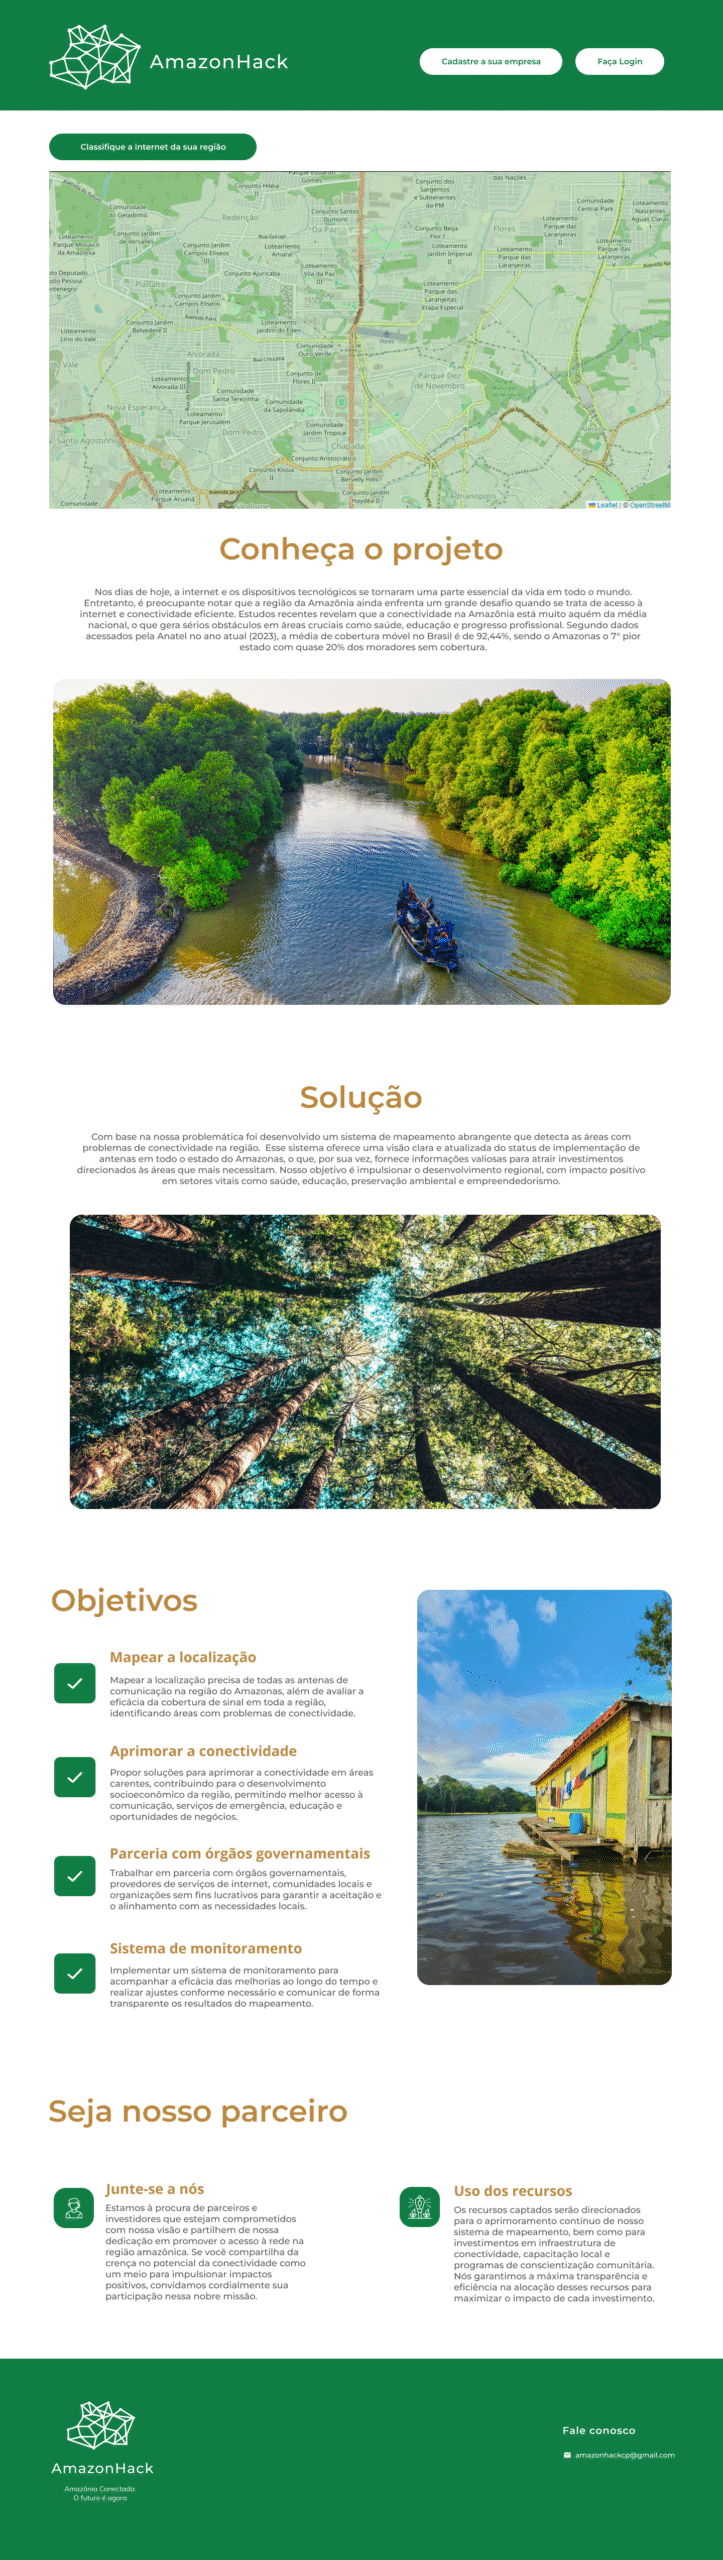
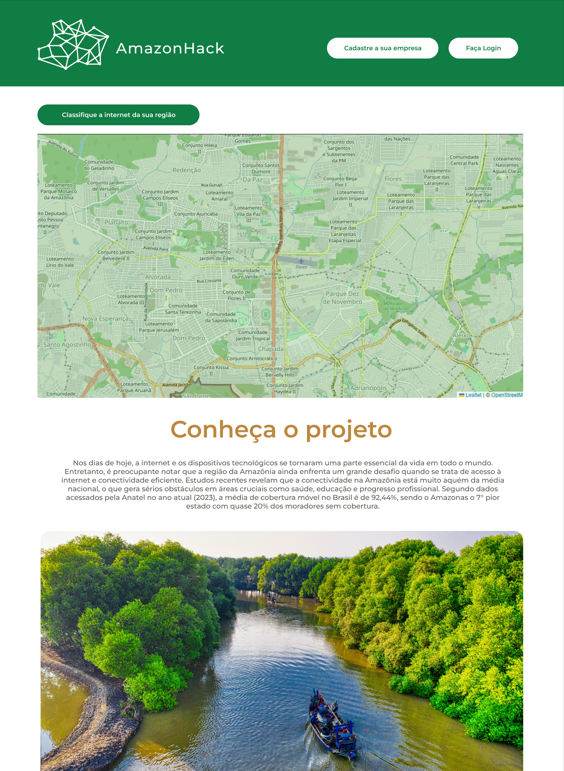
We designed a monitoring website to map areas lacking connectivity, allowing companies and facilities to manually register this information. With the developer team, we outlined the system’s functionality and design within a tight 48-hour timeframe; thus, it was as follows: Register of Provider Companies; Register the company; Antenna Registry; Map View and User NPS
Benchmarking
With the main functions of our website delimited, we did a competitive analysis to see if there were direct competitors and how they work. We locate only Anatel which has a similar system with an interactive map, however it does not allow you to perform the search by location or receive reviews about how the signal is in each location.
Wireframe
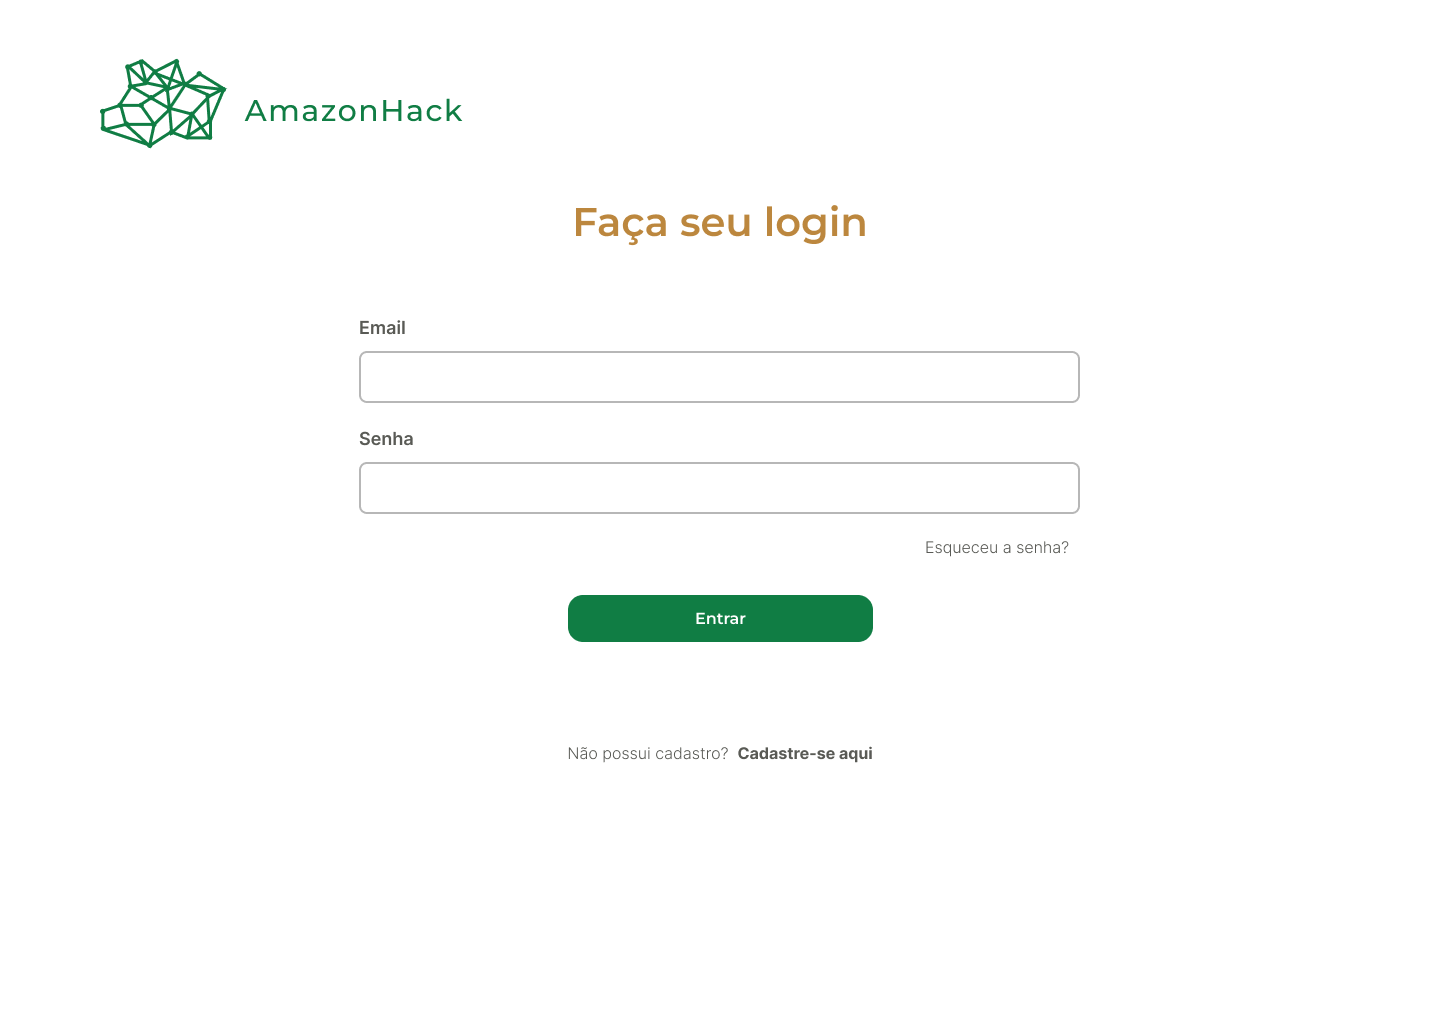
We defined the solution and the features. Together with the developers, we started drawing the screenshots. We created the Homepage with the main project information and the highlighted interactive map, a company register screen, a network register screen and a login screen. We also created a module to collect the NPS of users on the signal in each region.
UI Design
I developed the visual identity for our brand, Amazonhack, and designed the website interface. Focused on connectivity in the Amazon state, I created a logo resembling the state map with interconnecting points, symbolizing our project’s mission. The color scheme of brown, green, and black represents land, trees, and connectivity, reflecting harmony and the Amazon environment.
Pitch
We developed our pitch together, in a narrated slide format, exposing the main information of our project, explaining the operation of the AmazonHack site, the tools we use to produce it, the roadmap and the next steps.